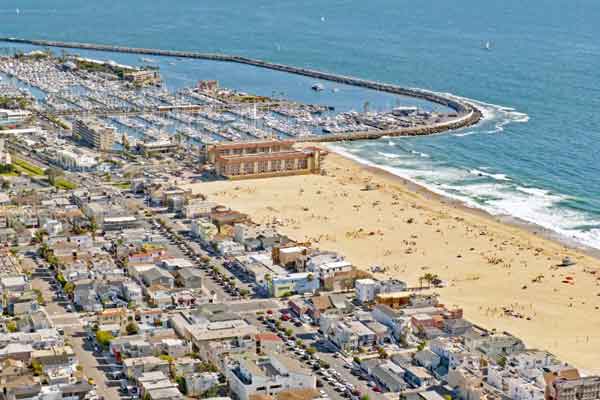
May 2023 Home sales in hermosa beach CA
see the 15 hermosa homes that sold last month
The local Hermosa Beach real estate market picked up quite a bit with 14 closed sales in May 2023.
The average “list” price was an incredible (borderline ridiulous) $5,142,733 with the average sold price at $5,024,442 which was dramatically higher than the $3,259,929 in April. This was in large part to a few MASSIVE sales during the month and the highest average we’ve ever seen.
The average price per foot was an impressive $1315 and homes averaged 98 days on market before going into escrow….but that was misleading as one of the oceanfront sales had been on the market for several years which dramatically skewed the numbers.

Search the current homes for sale in Hermosa
The agent providing the information contained herein may not have been a buyer’s and/or seller’s agent. This report is based on data pulled from CRMLS on 6/4/23
May 2023 Property Sales and Home Prices in Hermosa Beach
| Type | Address | Price | $ Per Foot | Bed/ Bath | Sq Feet | Age | |
| TWNHS/A | 501 | Herondo st #11 | $1,313,000 | $912 | 2/2,0,1,0 | 1439/A | 1987/ASR |
| TWNHS/D | 1634 | Loma DR | $3,200,000 | $1,468 | 3/3,0,0,0 | 2180/A | 2008/ASR |
| TWNHS/D | 57 | 20th Court | $3,818,625 | $1,474 | 3/3,0,1,0 | 2590/E | 2006/ASR |
| TWNHS/A | 1703 | Manhattan AVE | $5,600,000 | $1,289 | 6/6,0,2,0 | 4346/O | 2022/BLD |
| SFR/D | 231 | 26th ST | $6,350,000 | $1,588 | 4/4,1,0,0 | 4000/B | 2023/BLD |
| SFR | 57 | 7th ST | $6,500,000 | $1,530 | 4/4,0,2,0 | 4247/ | 2021/BLD |
| SFR/D | 2806 | The Strand | $15,150,000 | $2,209 | 6/3,2,3,0 | 6857/SEE | 2012/ASR |
| SFR/A | 2826 | The Strand | $18,590,000 | $2,340 | 5/6,0,2,0 | 7946/A | 2010/APP |
| CONDO/A | 1720 | Ardmore AVE #303 | $1,010,000 | $1,179 | 2/1,1,0,0 | 857/A | 1970/ASR |
| CONDO/A | 501 | Herondo ST #62 | $1,200,000 | $834 | 2/3,0,0,0 | 1439/A | 1987/ASR |
| DPLX/A | 733 | 30th ST | $2,175,000 | $1,101 | 4/ | 1976/A | 1949/ASR |
| TWNHS/A | 646 | 1st ST | $2,585,000 | $900 | 4/3,0,1,0 | 2873/A | 1998/ASR |
| TWNHS/D | 606 | Boundary PL | $3,100,000 | $925 | 4/4,0,0,0 | 3350/A | 2016/ASR |
| CONDO/A | 929 | 1st ST #A | $1,780,000 | $937 | 3/2,0,1,0 | 1900/E | 2012/ASR |
| SFR/D | 1025 | 8th PL | $2,995,000 | $1,053 | 4/2,0,1,0 | 2844/SEE | 1989/PUB |
